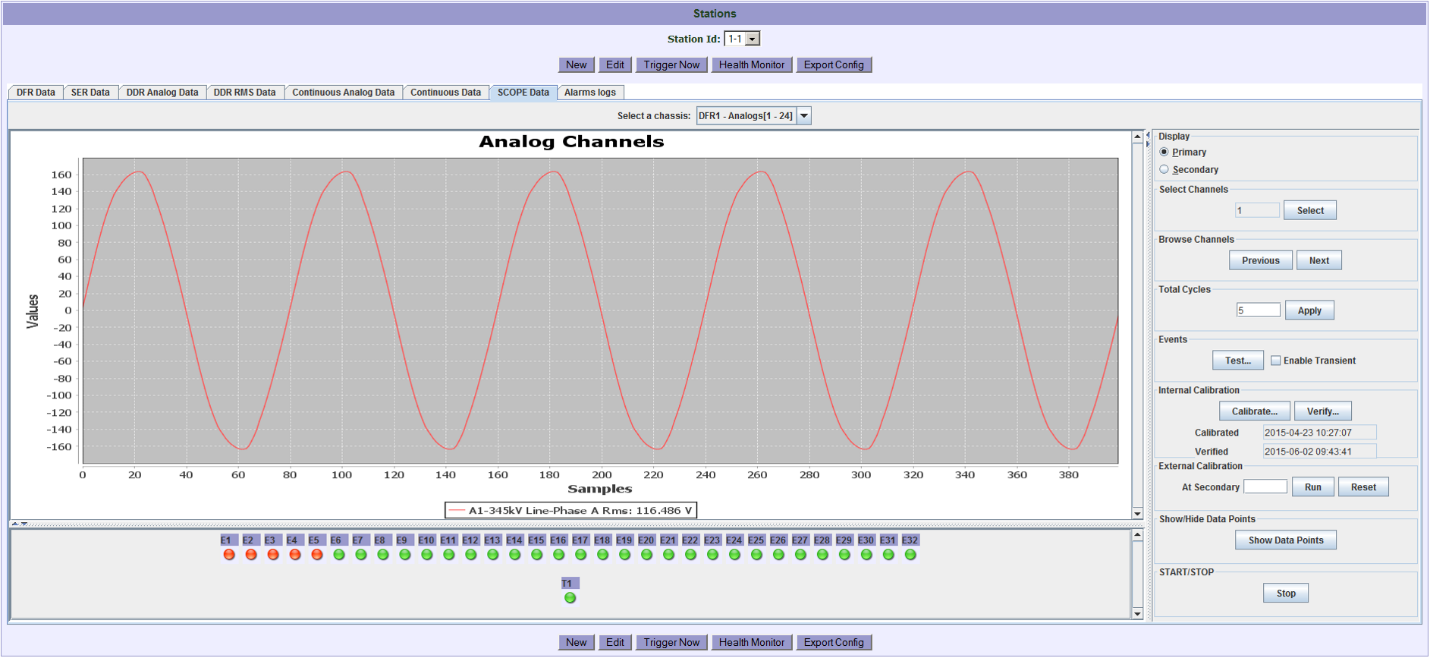
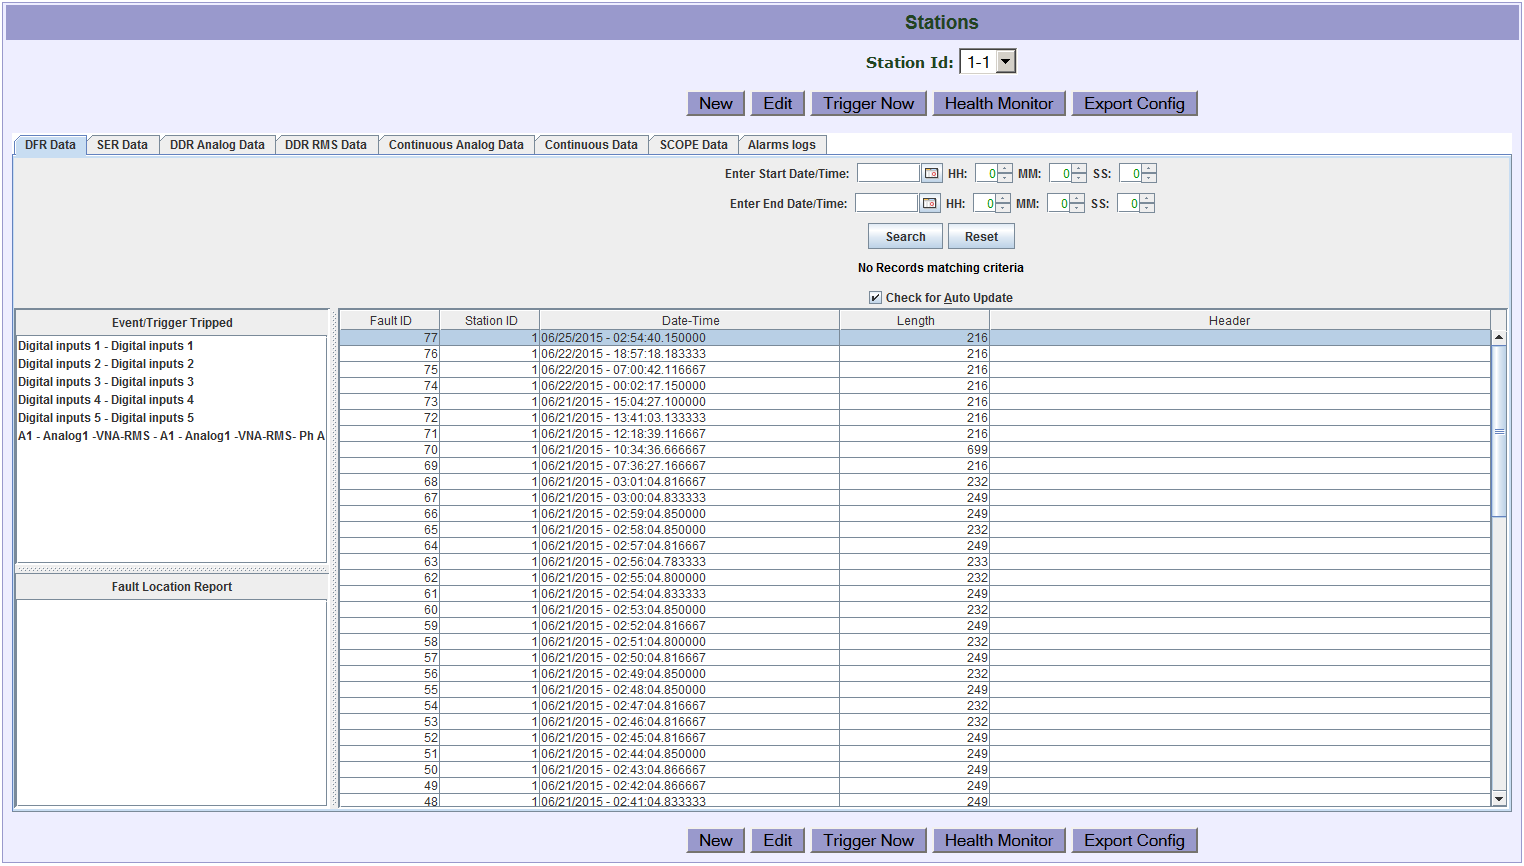
The Digital Fault Recorder (DFR) function of the USI DME systems provides our customers with the ability to analyze system protection operations and circuit breaker performance. USI DRFs record instantaneous values (waveforms) of current and voltages, which are sampled many times per cycle, for time periods on the order of a second. May also record computed quantities
Overall, the purpose of a DFR includes recording power system events (voltage & current magnitudes), capturing the exact time at which a fault occurred, power swings, and abnormal instruments transformer behavior, such as CT saturation, DC offset (inductance of the system), and CCVT response. Additionally, a DFR monitors the protection systems’ performance and checks the power system for failures of a relay to operate as intended (retrofit, trip test switch open, etc.), incorrect tripping of terminals for external faults, determining the optimum line reclose delay, and failure of fault interrupting devices.
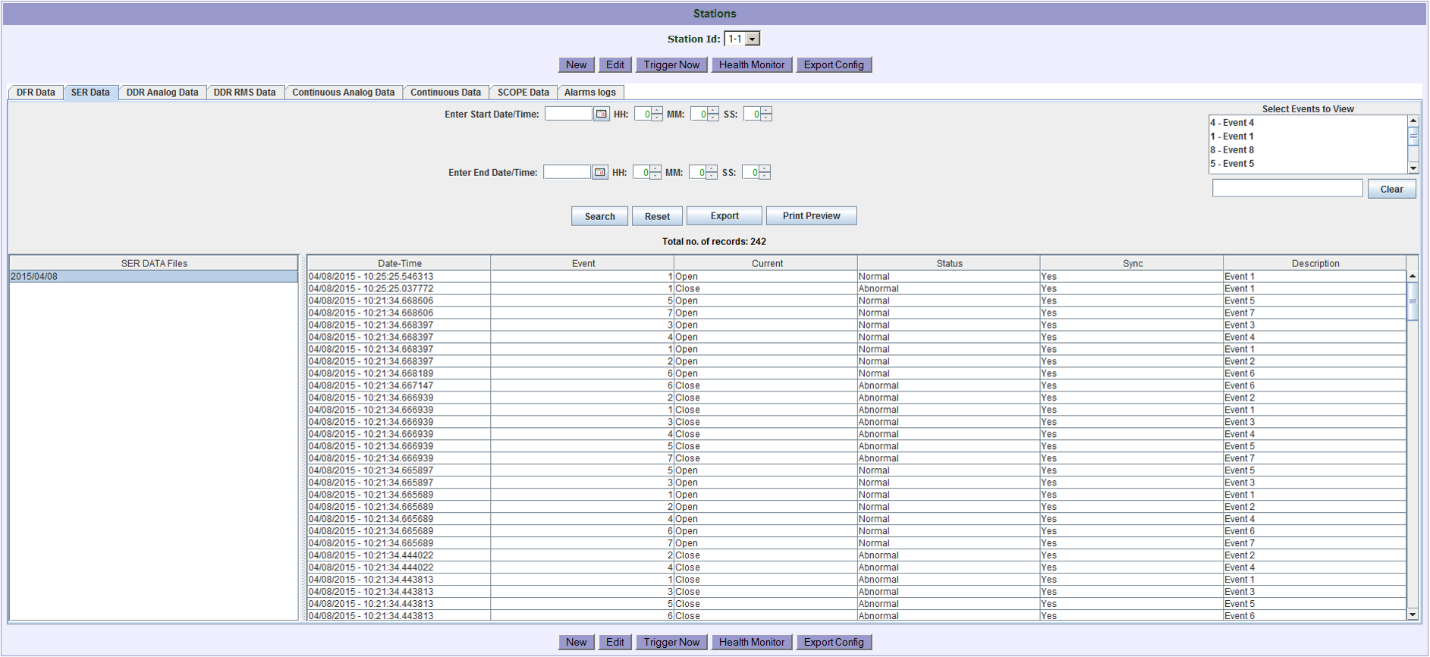
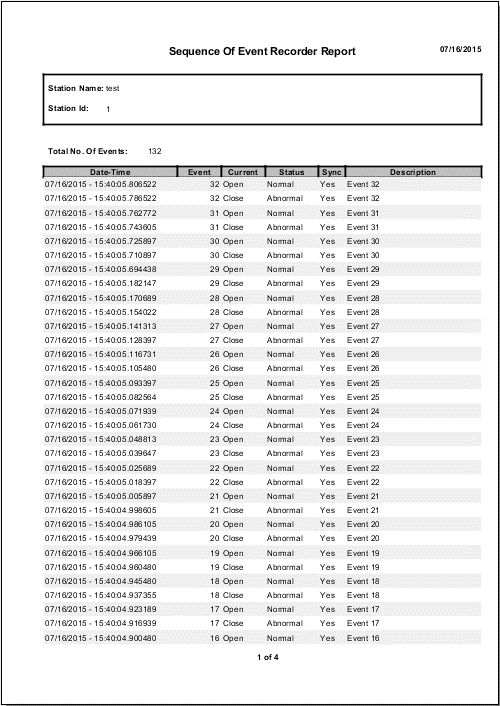
The Sequence of Events Recorder (SER) function can be found in both USI DME systems and standalone USI SER systems. The SER function monitors external inputs and records status changes that occur in the power system. To accomplish this function the SER samples and time stamps operational data in the chronological sequence in which the events take place. This operational data is monitored from substation equipment (i.e., relays, circuit breakers, etc.) and control schemes (automatic and manual) as they react to an event that takes place within the power systems the SER is monitoring. When collected, this data, which can be caused by several different individual events such as a switching operation, mis-operation, or fault, allows the chain of events to be analyzed and studied when searching for the cause of an event that took place within the power systems, as well as the linkages between individual actions and effects.
| RECORDING: | |
| Maximum Sample Frequency | 24kHz per channel |
| Pre-Fault | 100-9999 milliseconds |
| Post-Fault | 100-9999 milliseconds |
| Fault Limit | 100-9999 milliseconds |
| Maximum Record Length | 40 seconds @ 24kHz Sample Frequency |
| ANALOG INPUTS: | |
| Voltage | 400Vrms |
| Voltage Accuracy | 0.01% of Reading + 0.005% of Full Scale |
| Amperes | 200Arms for 2 seconds – 15Arms Continuously |
| Ampere Accuracy | 0.25% of Reading + 0.005% of Full Scale |
| Resolution | 16 bit |
| Bandwidth | DC to 5kHz |
| Linearity | 0.01% of Full Scale Typical |
| Isolation: | 200Vrms channel to channel |
| 200Vrms channel to ground | |
| Trigger Types: | RMS (Over, Under, or Both) |
| Frequency (Over, Under, or Both) | |
| Harmonic | |
| Total Harmonic Distortion (THD) | |
| Watts | |
| VAR | |
| +/-/0 Sequence | |
| Automatic Post-Fault Re-Trigger | |
| DIGITAL INPUTS: | |
| Input Voltage | Universal Input Range of 40VDC – 250VDC |
| Current Draw | 2mA |
| Trigger | Normal to Abnormal, Abnormal to Normal, Either, or Inhibit |
| Filtering | Chatter and Debounce Filter |
| TIME SYNCHRONIZATION: | |
| IRIG-B (Modulated) | <1 millisecond |
| IRIG-B (Un-Modulated) | <1 microsecond |
| POWER SUPPLY: | |
| 36-75VDC | |
| 66-154VDC | |
| 100-375VDC | |
| ENVIRONMENTAL: | |
| Temperature | 0-55°C |
| Humidity | Up to 90% Non-Condensing |
ANALOG INPUTS: ANALOG INPUTS:
| DIGITAL INPUTS: | |
| Input Voltage | Universal Input Range of 40VDC – 250VDC |
| Current Draw | 2mA |
| Post-Fault | 100-9999 milliseconds |
| Trigger | Normal to Abnormal, Abnormal to Normal, Either, or Inhibit |
| Filtering | Chatter and Debounce Filter |
| ENVIRONMENTAL: | |
| Temperature | 0 – 55°C |
| Humidity | Up to 90% Non-Condensing |
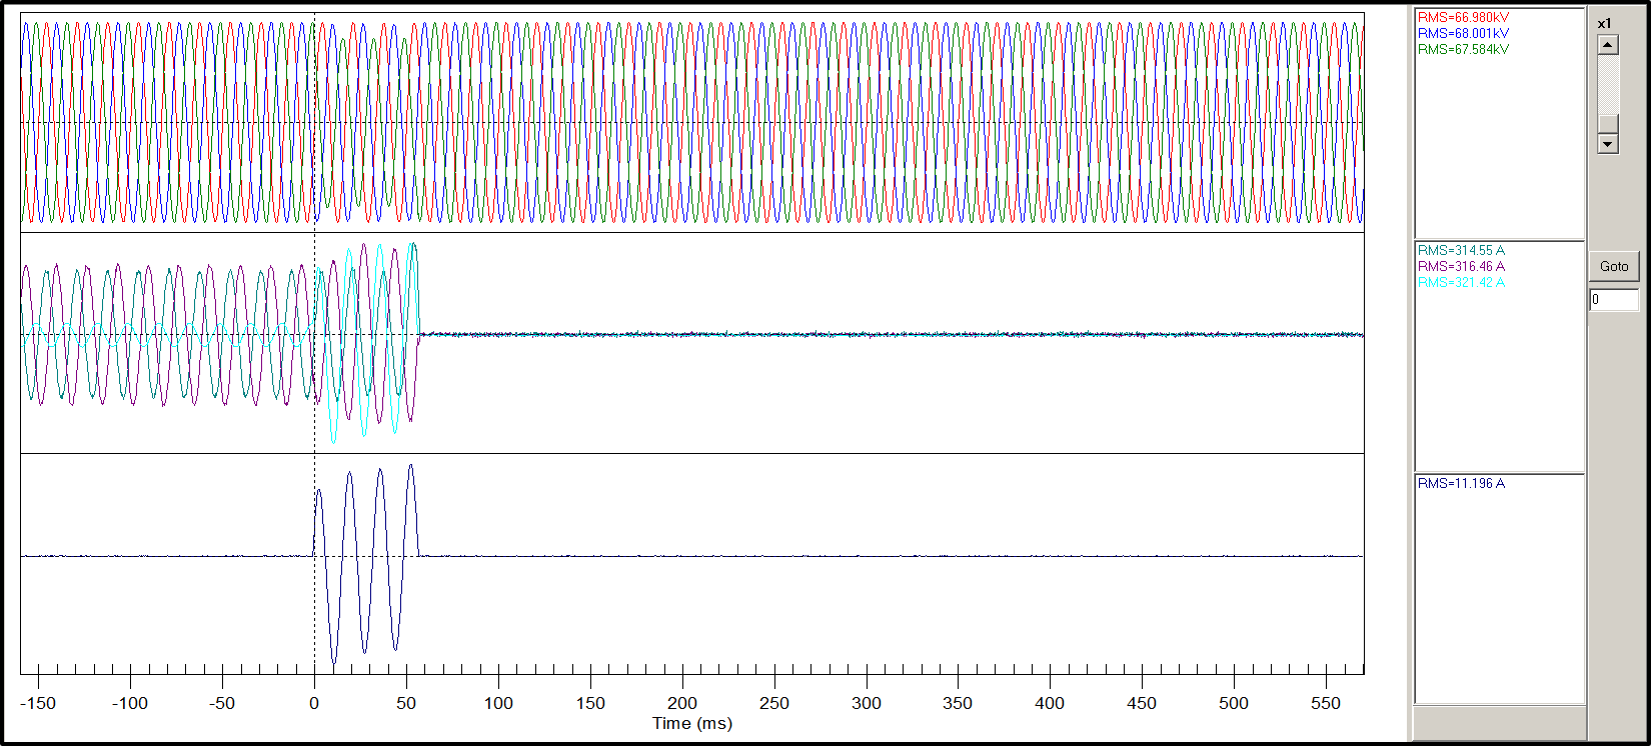
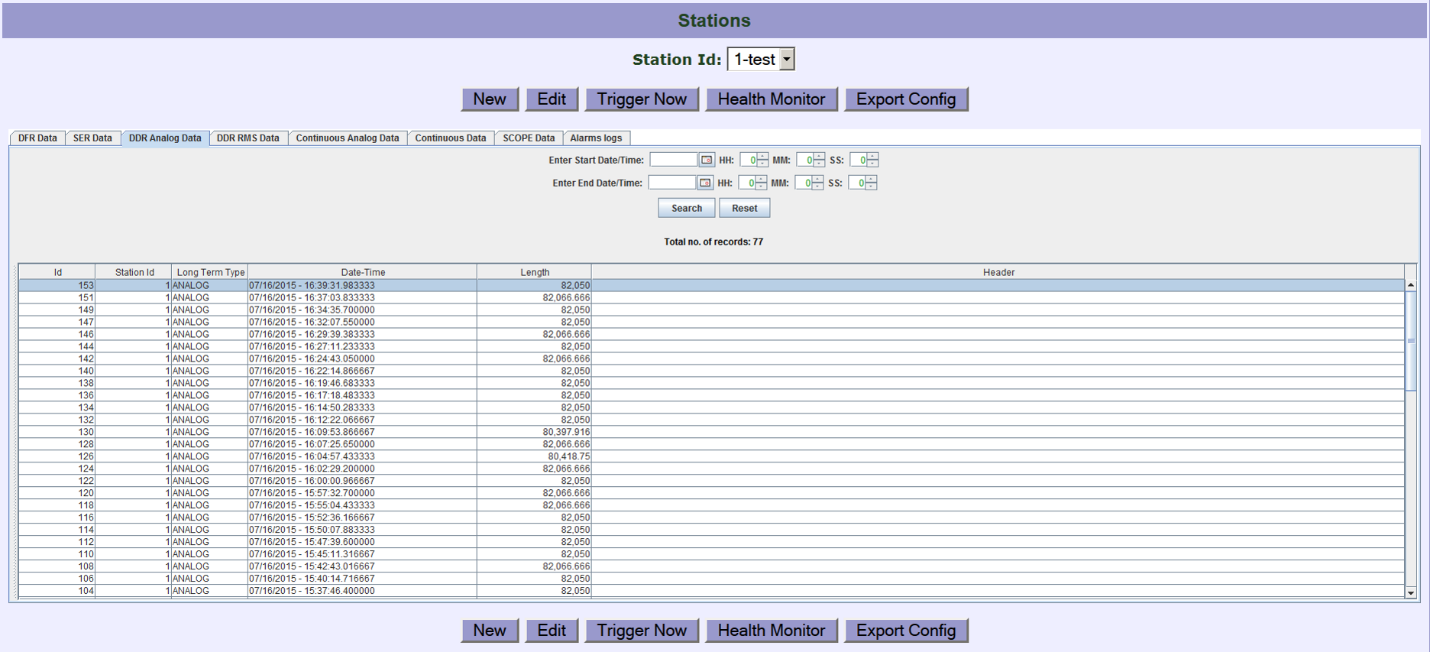
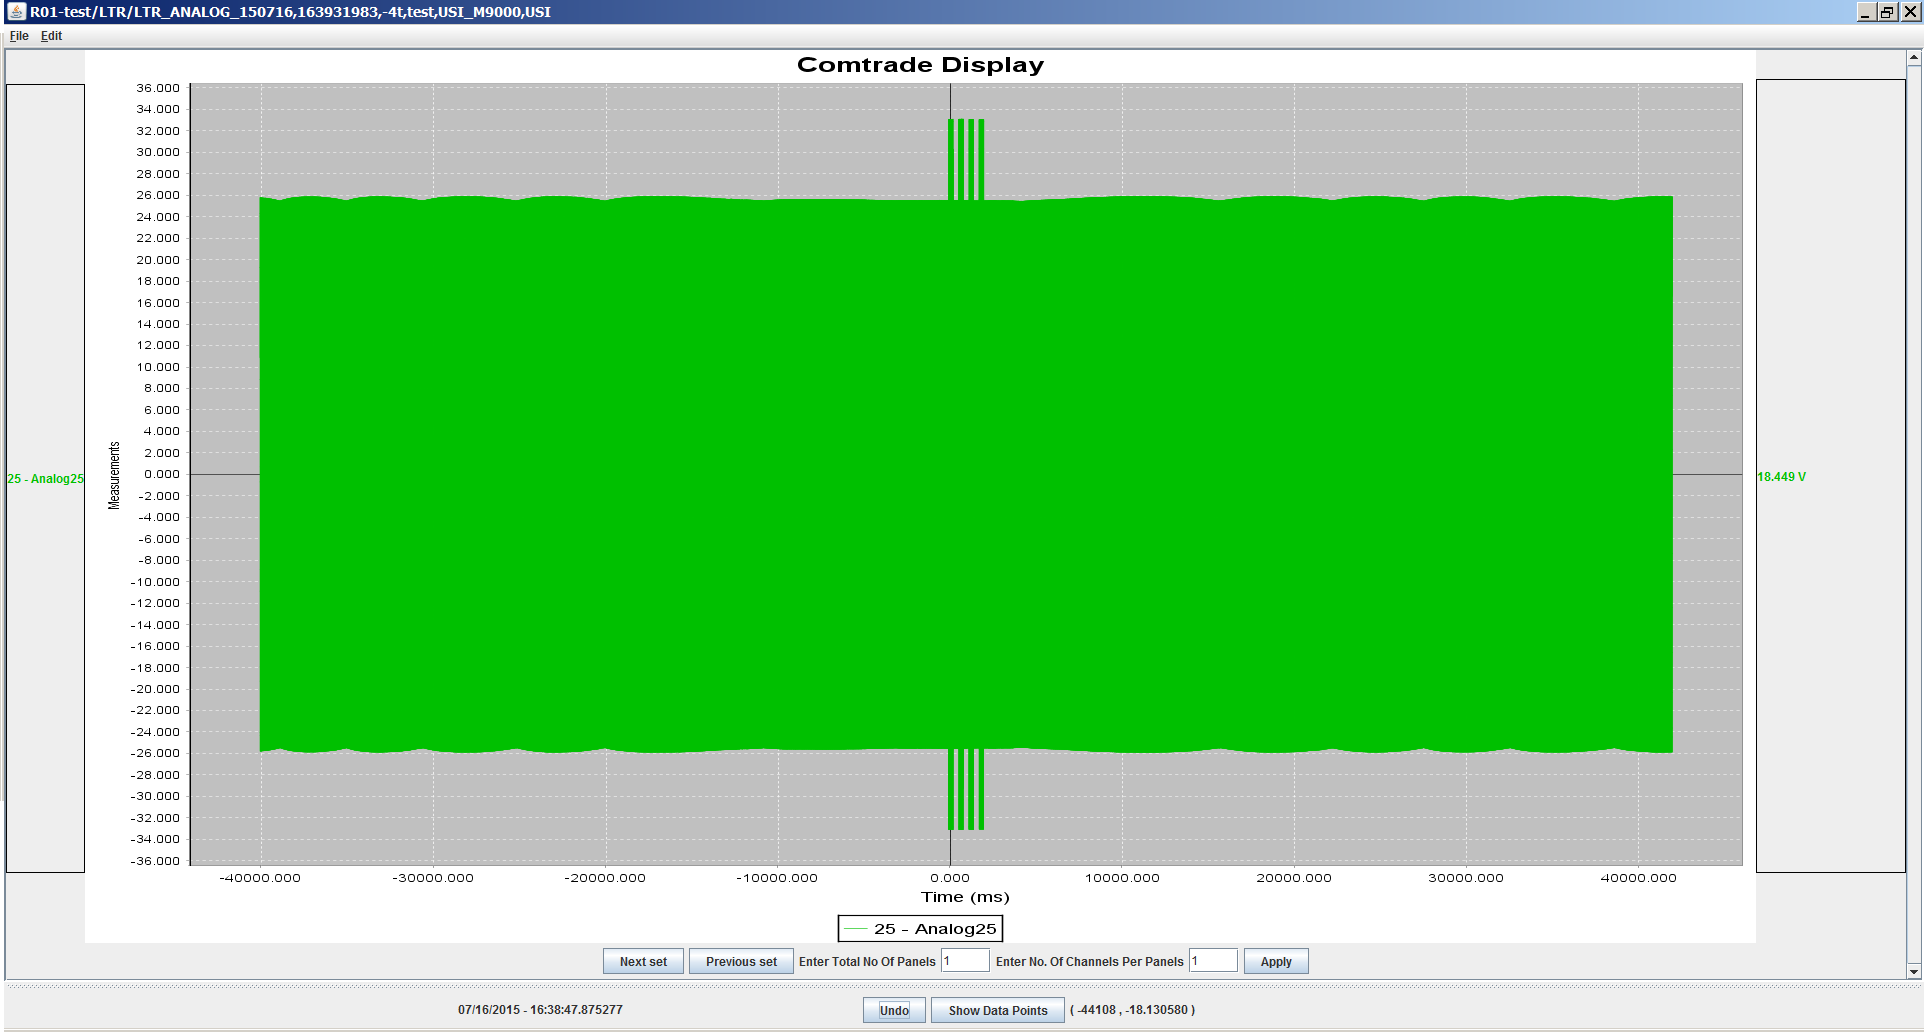
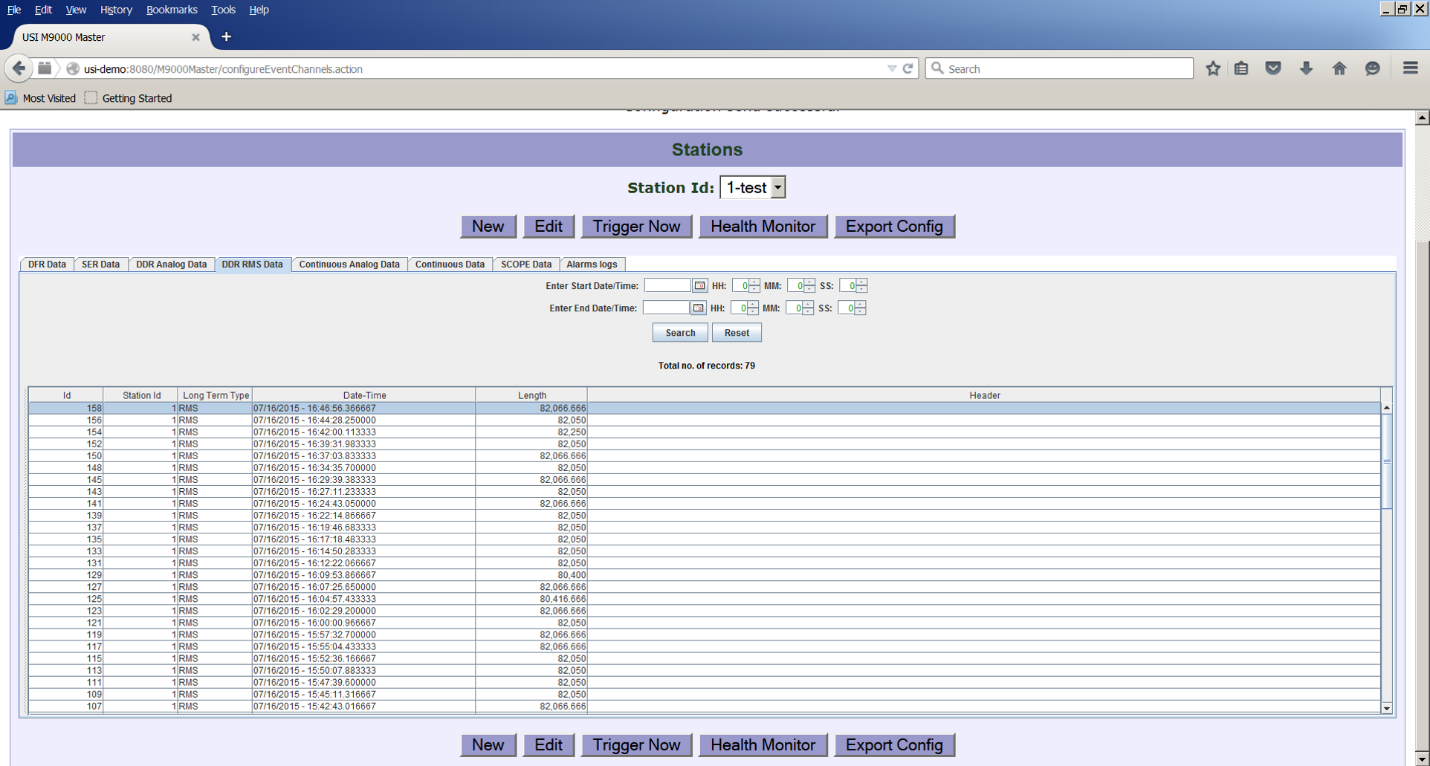
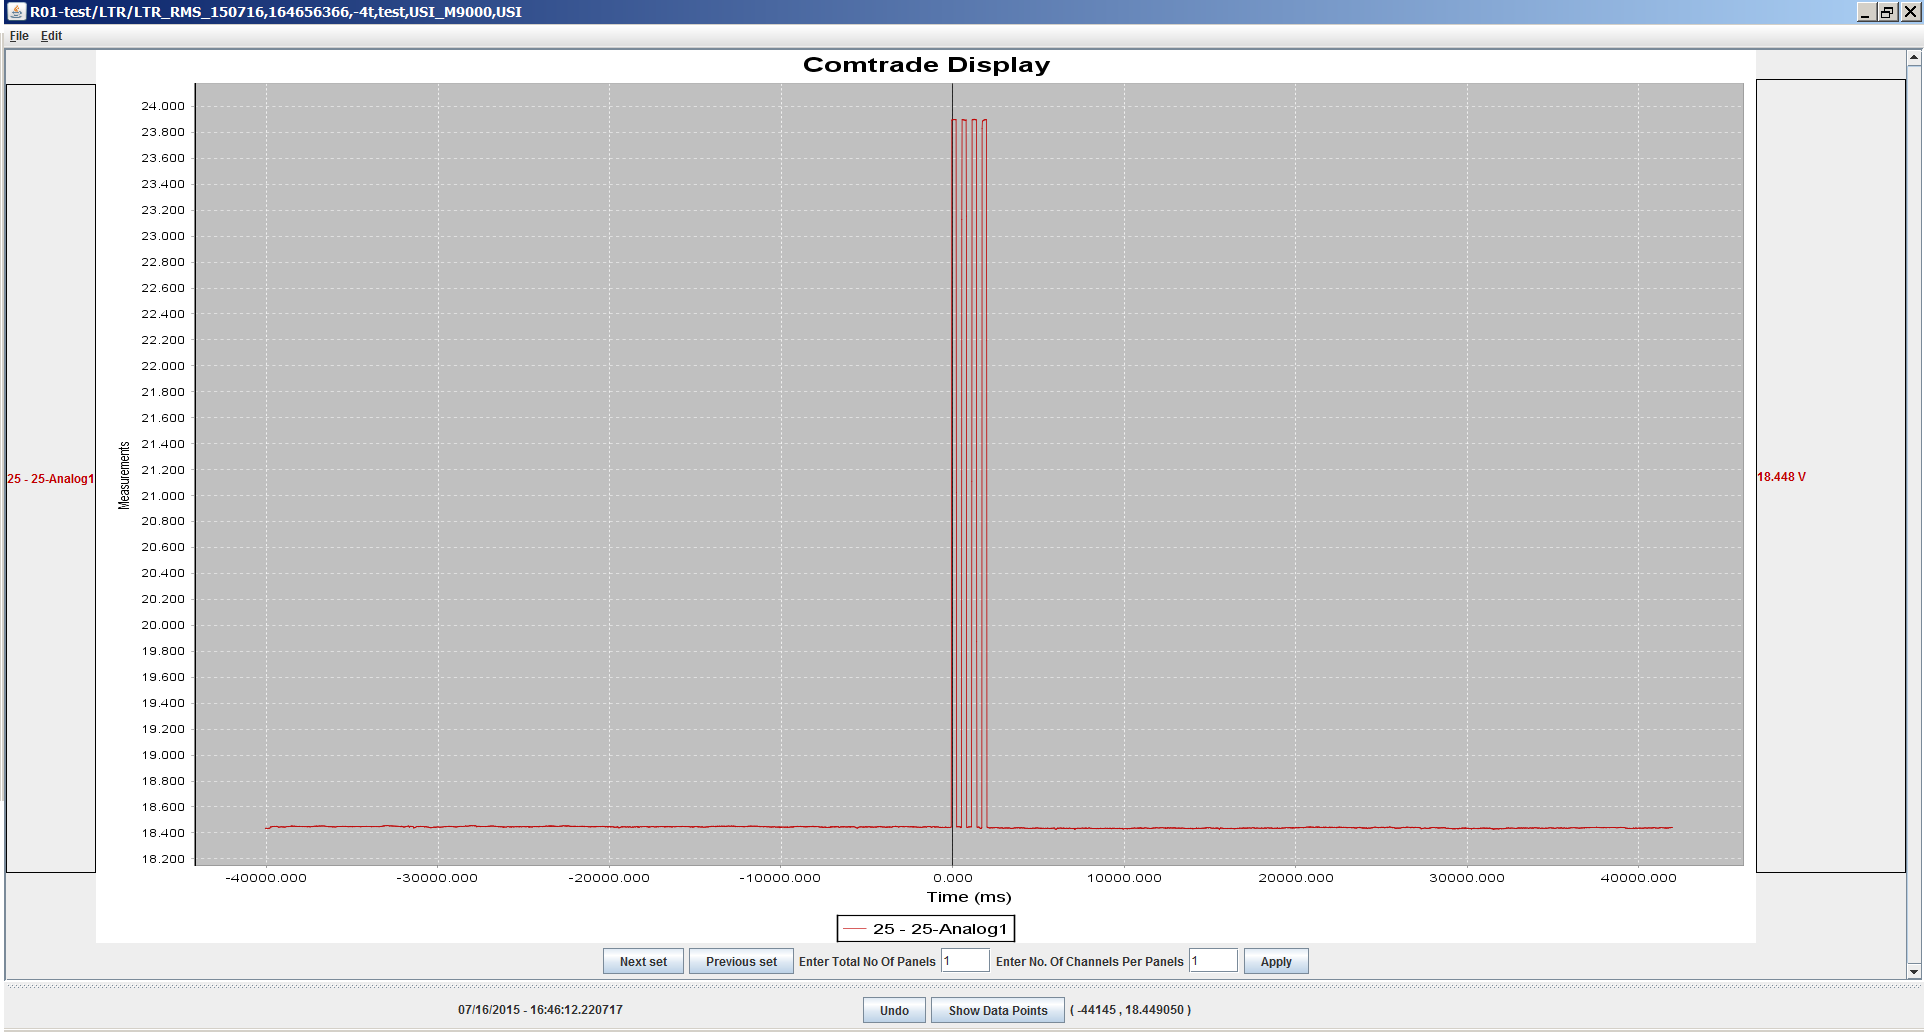
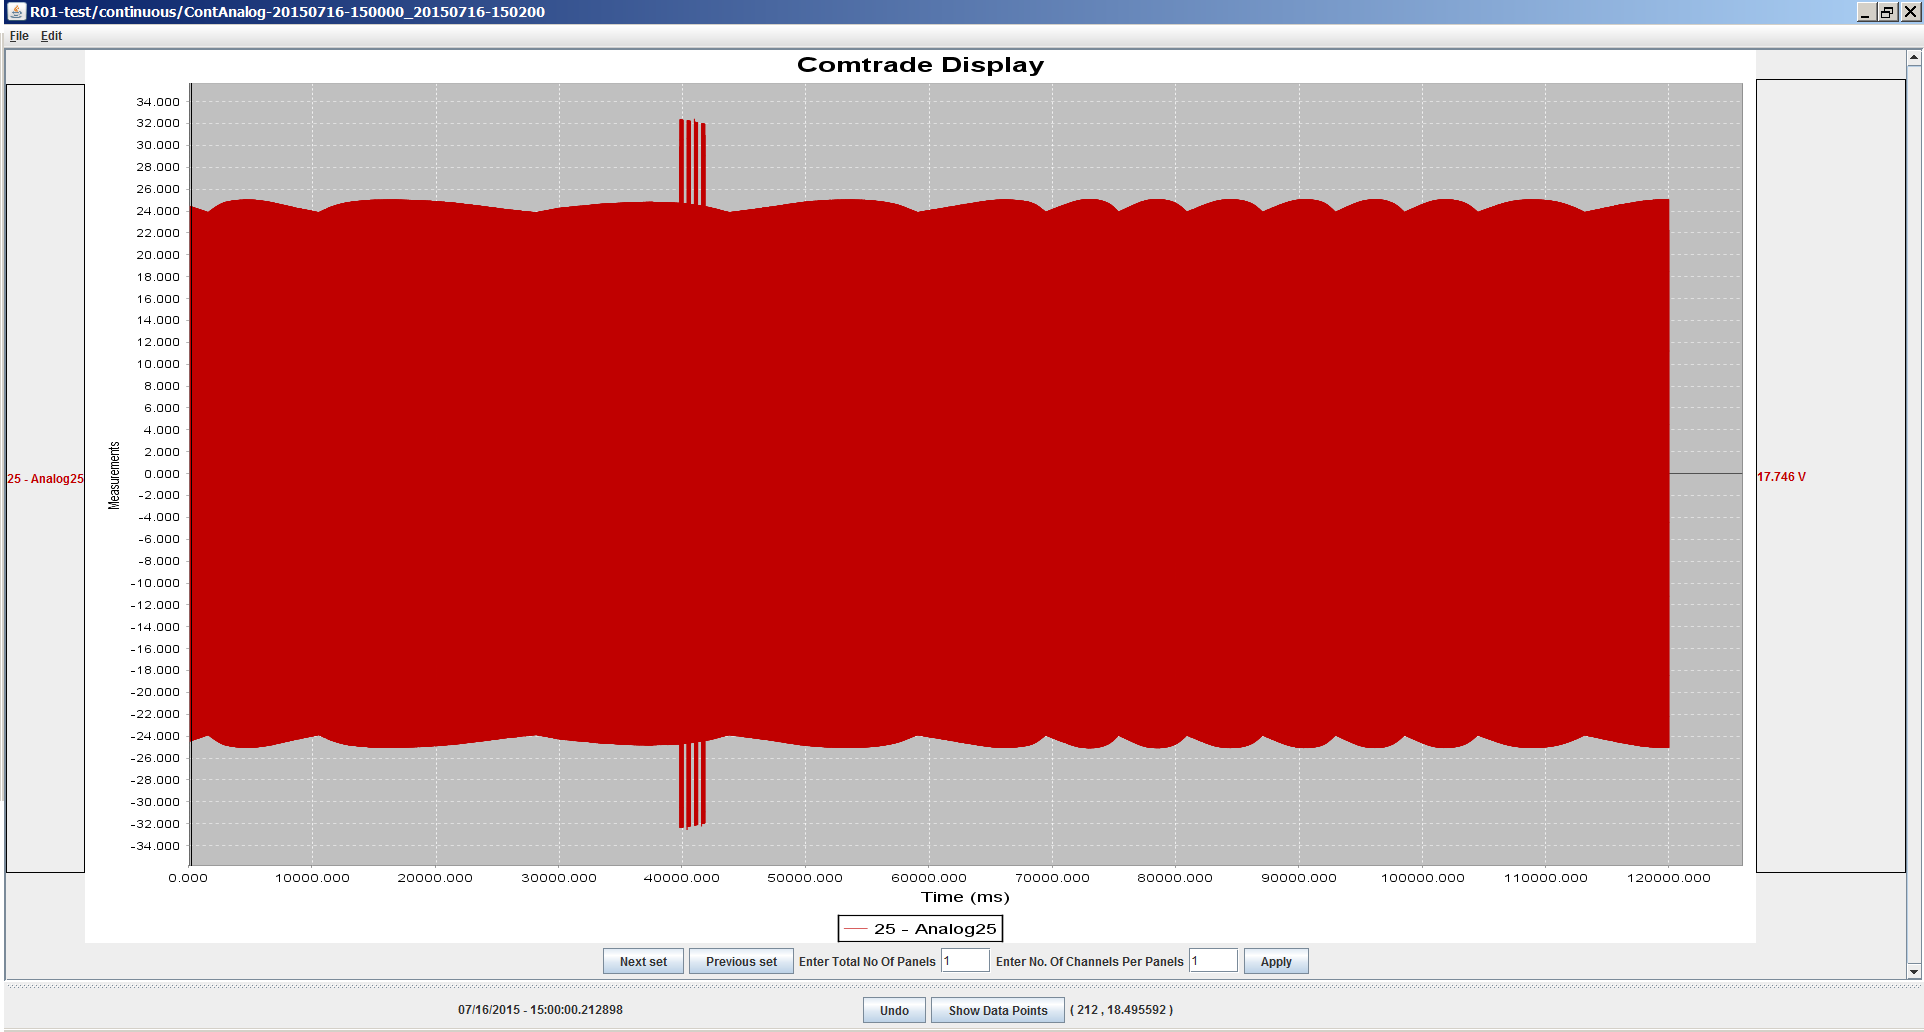
The Dynamic Disturbance Reorder (DDR) function is a standard feature found on USI™ DME Systems. The DDR function analyzes complex power systems events and records the dynamic response of power systems to disturbances that have occurred within the same system. DDRs are extremely useful for disturbance analysis, investigating system oscillations, quantifying sudden changes in power system parameters, and obtaining data for verifying stability models. The DDR is normally used by utilities for low-speed disturbance recording and to capture records that are typically from 1 minute to 1 hour in length. The USI™ DDR function recorders frequency, phase angle, and RMS values of a power systems’ quantities. These quantities include voltage magnitude, current, MW, and MVAR, sampled and calculated at a rapid rate (i.e., 6 to 60 samples or more) per second. Recording duration is generally on the order of a minute or more.
| Sampled Data: | |
| Maximum Sample Frequency | 2.4kHz per channel |
| Calculated RMS Values: | |
| Maximum Measurement Frequency | 60Hz per channel |
| Record Lengths: | |
| Pre-Fault | 10 – 990 seconds |
| Post-Fault | 10 – 990 seconds |
| Fault Limit | 10 – 990 seconds |
| Maximum Record Length | 33 minutes |
| Trigger Types: | RMS (Over, Under, or Both) |
| Frequency (Over, Under, or Both) | |
| Harmonic | |
| Total Harmonic Distortion (THD) | |
| Watts | |
| VAR | |
| +/-/0 Sequence | |
| Rate of Change on all Units | |
| Duration | |
| Automatic Post-Fault Re-Trigger |
| Sampled Data: | |
| Maximum Sample Frequency | 2.4kHz per channel |
| Maximum Record Length | 5 Days |
| Calculated Values: | |
| Maximum Sample Frequency | 60Hz per channel |
| Record Lengths: | 30 Days @ 60 Hz Record Frequency |
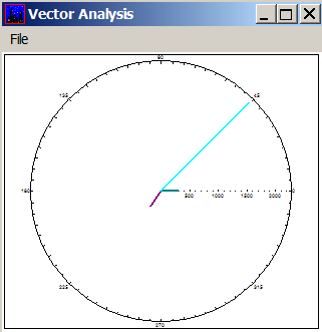
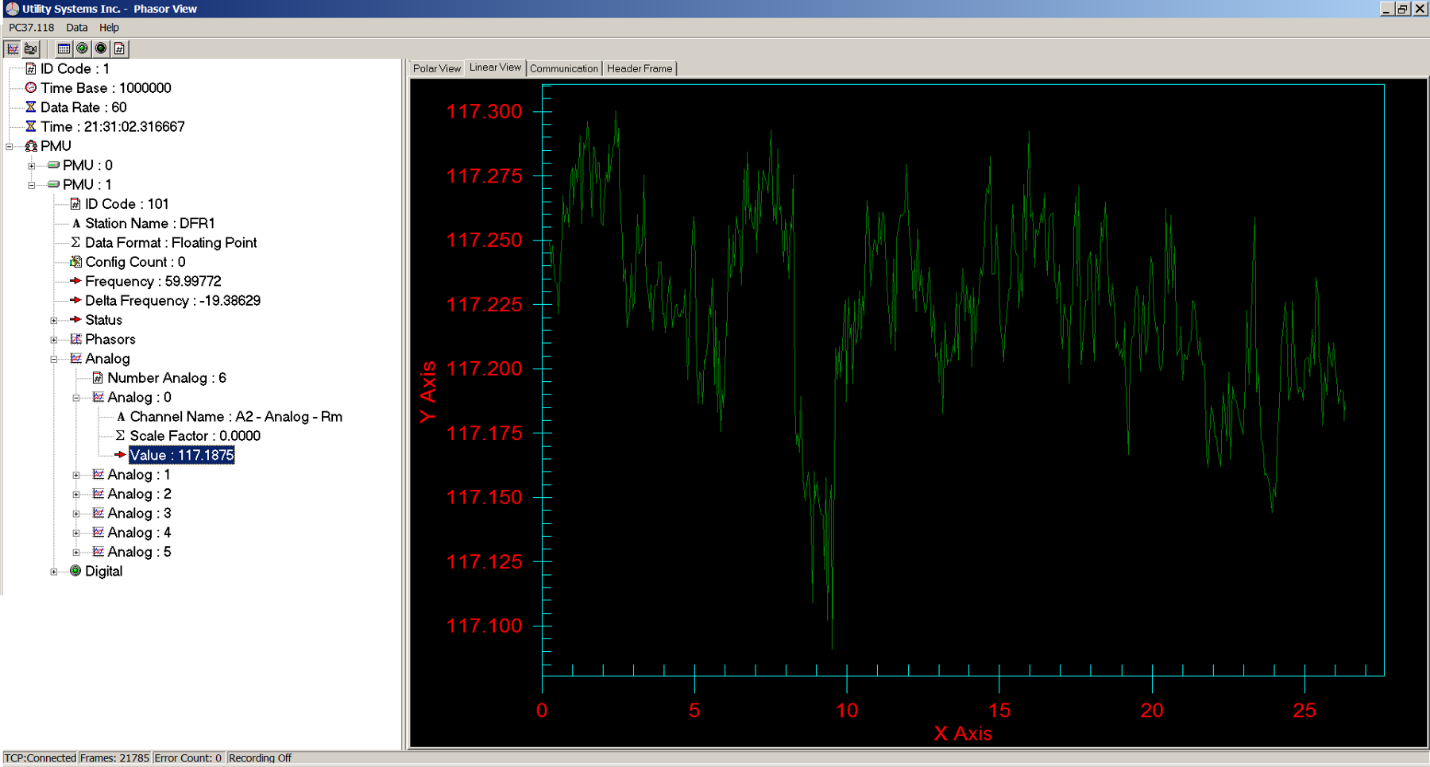
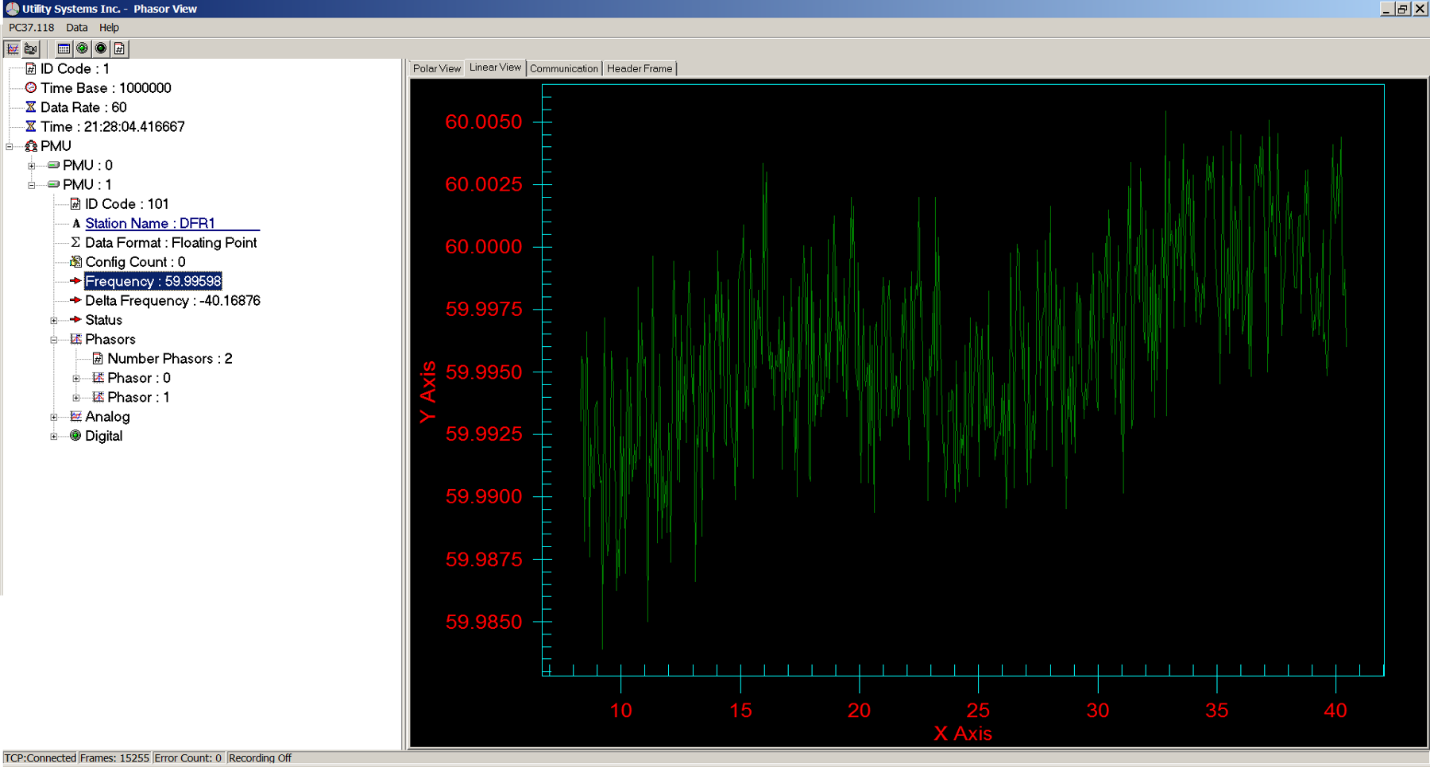
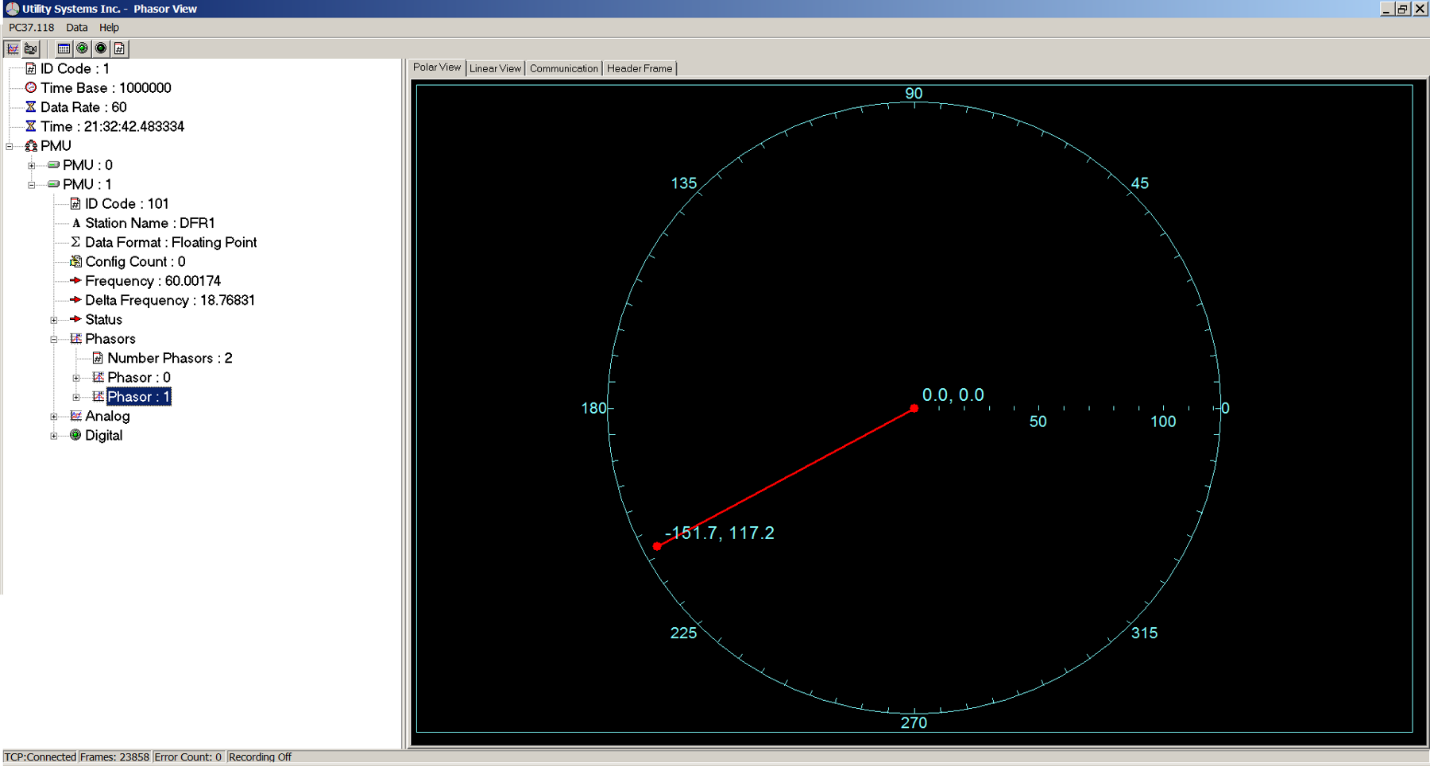
The Phasor Measurement Unit is a device that is deployed to monitor the power grid by recording phasor quantities and accurately referencing them to a standard time signal. To accomplish this, the PMU extracts the parameters magnitude, phase angle, frequency, and rate of change of frequency from the signals appearing at its input terminals. The USI™ Phasor Measurement Unit (PMU) is an optional add-on application that allows USI™ DME users to perform phasor measurement unit functions in addition to existing DME functions. This add-on package requires no additional hardware or modification to an existing DFR installation.
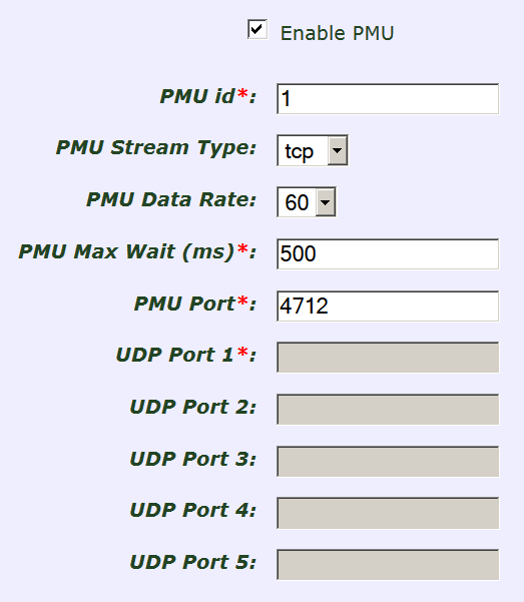
The USI™ PMU features synchrophasors available for each analog channel, positive sequence phasor calculated from any three-phase voltage or current inputs, analog values and digital input statues that can be added to the data stream, and user-defined frame rate (60Hz, 30Hz, 20Hz, 15Hz, 10Hz), all while conforming to the IEEE PC37.118 standard. Additionally, the USI PhasorView™ software (in accessories page), which allows real-time monitoring of synchrophasor data transmitted via the PC37.118 standard, comes with the USI PMU application at no additional cost.
| Compliance: | IEEE C37.118 (2005) |
| Phasors: | Analog (Discreet Phasor for all DFR Inputs up to 128A) |
| Positive Sequence Phasor for any 3-Phase Voltage or Current | |
| Digital (All DFR Inputs can be Included in the Data Stream) | |
| Sampling: | All Phasor Estimates Calculated from 4.8kHz |
| Data Frame Rate: | 10Hz, 15Hz, 20Hz, 30Hz, 60Hz |
| Time Synchronization: | |
| IRIG-B (Un-modulated) | <1 microsecond |
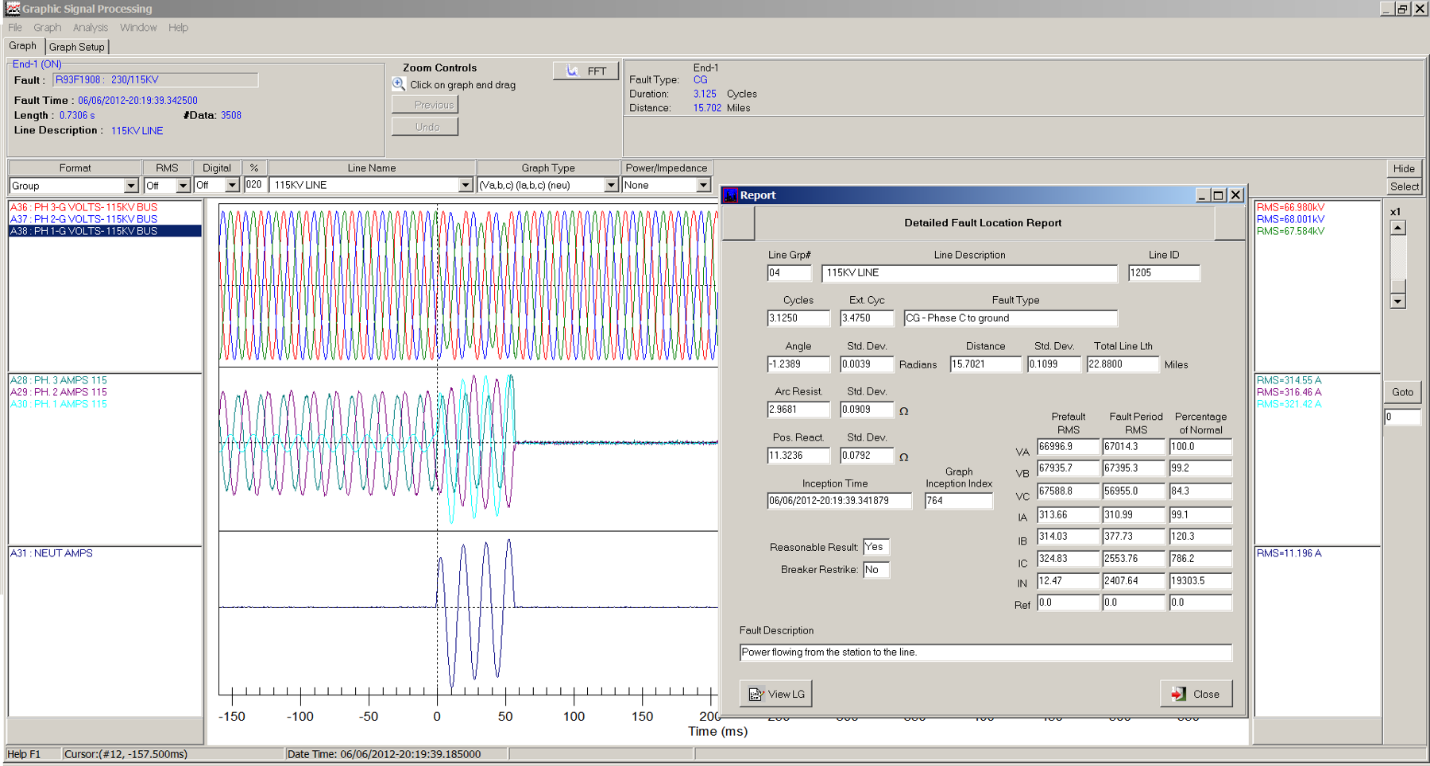
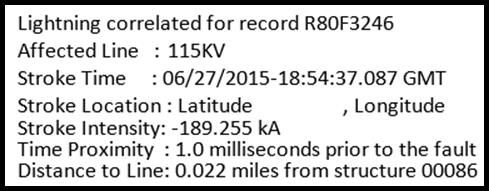
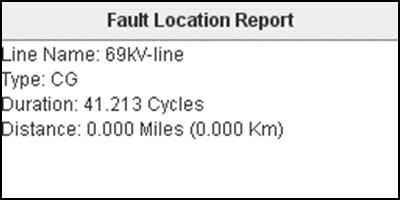
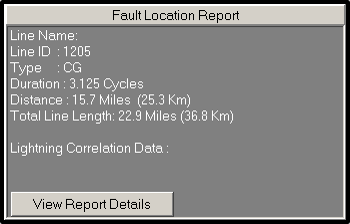
The USI™ Fault Location Application utilizes the logic built into the USI DME Systems to determine the faulted line, the fault period, the fault type, and calculate the fault location. The fault location result is displayed on our fault summary screen and can be automatically reported via email or DNP3 to field engineers and system control personnel.
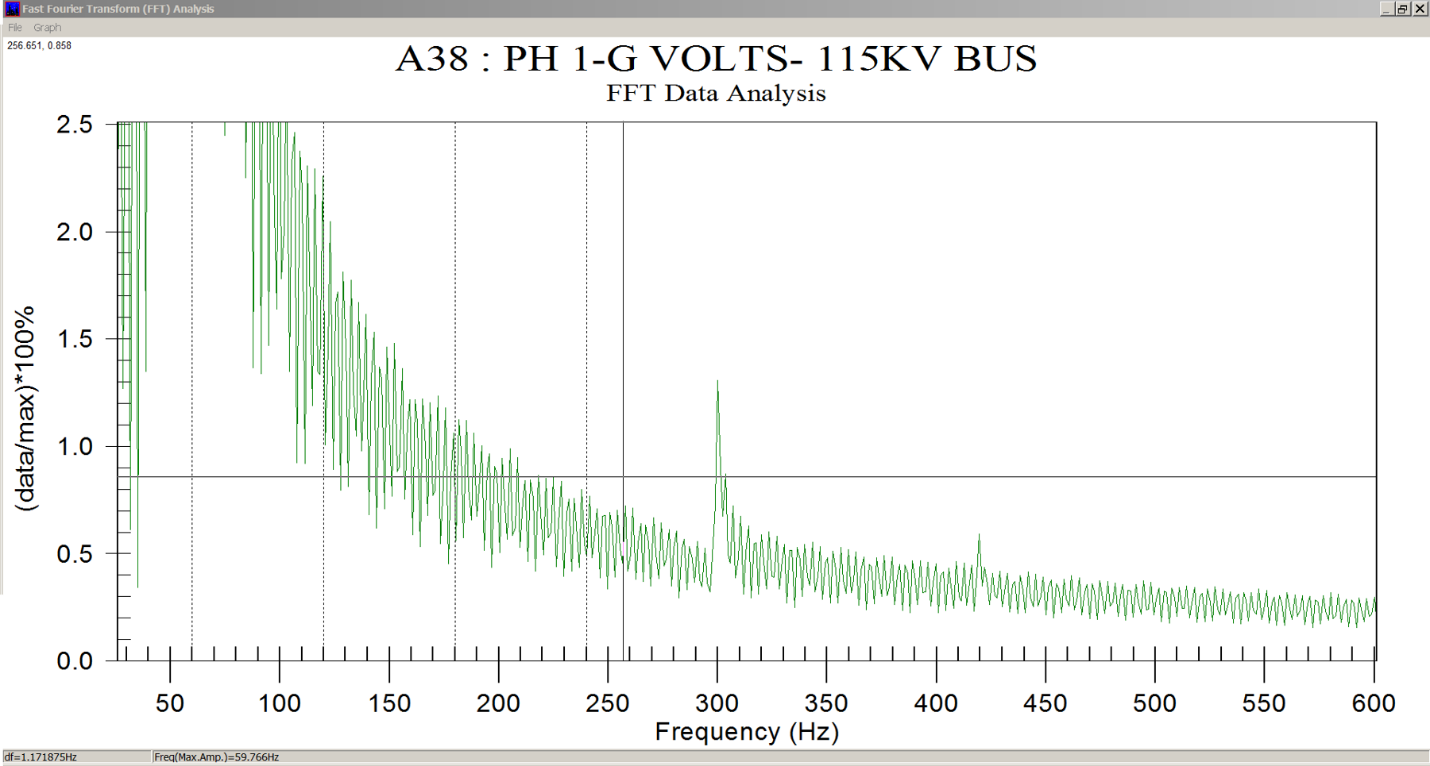
Power Quality is an industry-wide term that is used to describe electrical power that drives an electrical load and the load’s ability to function properly. A Power Quality Monitor (PQM) is designed to record power quality parameters (i.e., voltage dips, flicker, and harmonic content) and is used to help the user determine the health of an electrical power system. While a PMQ is normally set up for continuous recording at relatively low sampling rates, it also has the option to be reconfigured to switch to a higher sampling rate when it is triggered to do so either manually by the user or through pre-determined settings in the software. Utility Systems, Inc. is now happy to announce that the Model 9000 DME System has PQM Capabilities. Please enquire now!